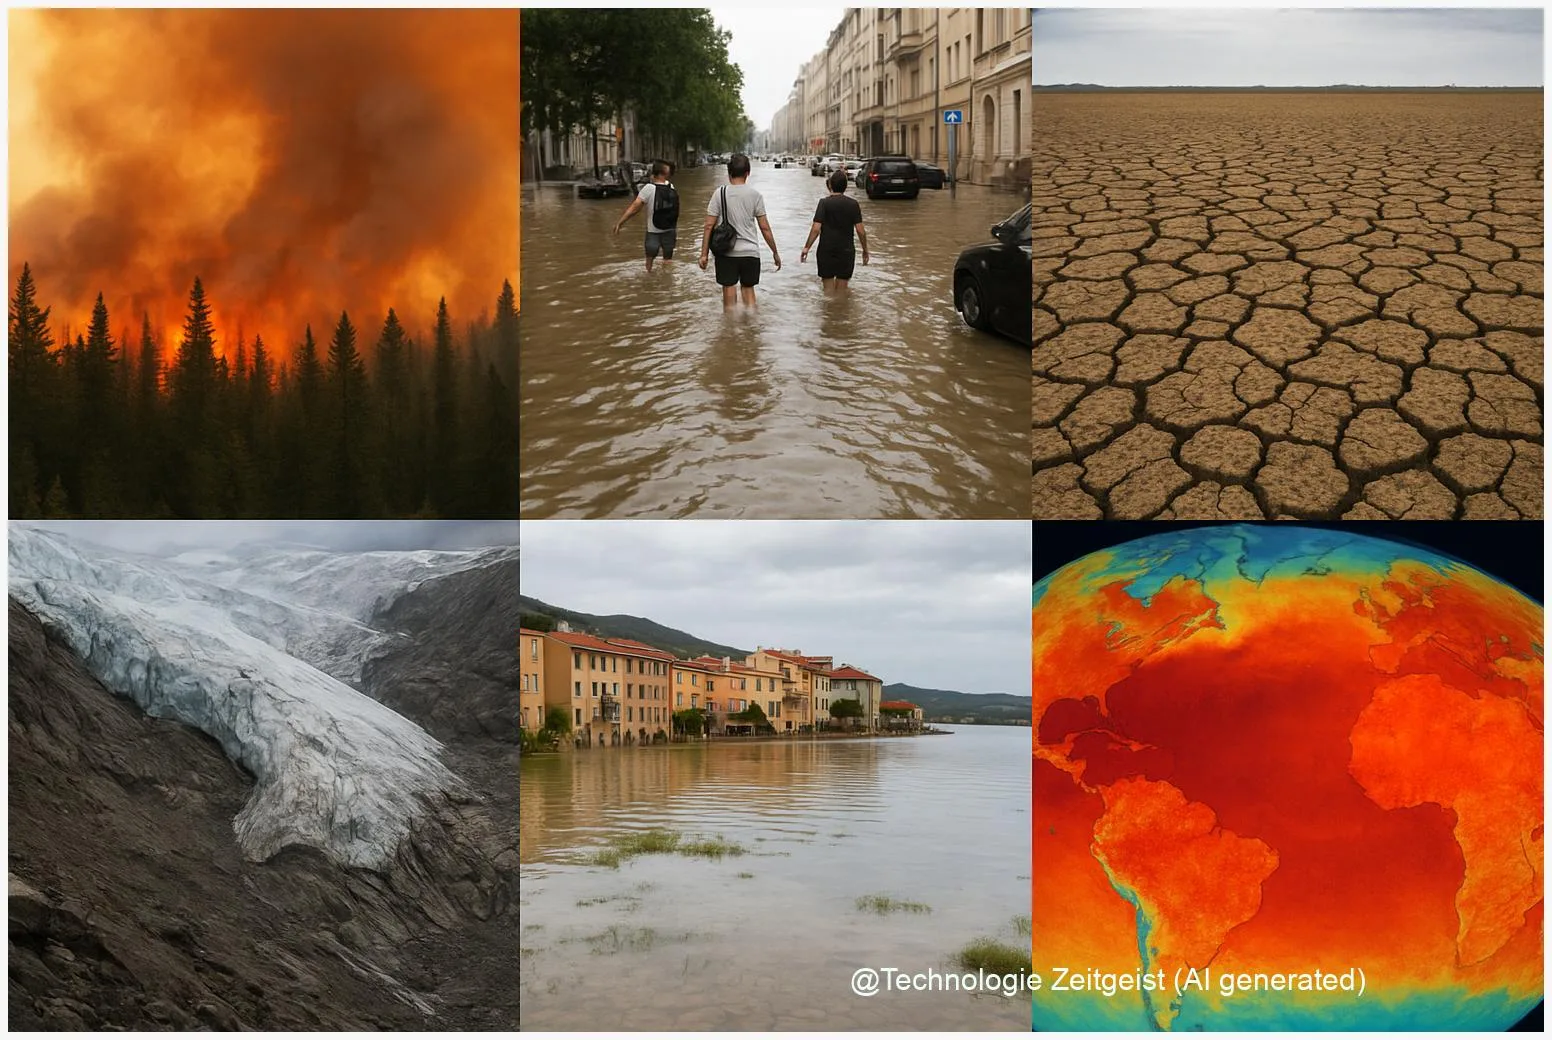
In 2025, climate change photos 2025 became a visual record of shifting weather and landscapes. Six recurring image types — extreme-heat cityscapes, wildfire scorched forests, flooded neighborhoods, cracked agricultural fields, retreating glaciers, and satellite heat maps — summed up how weather extremes and long-term shifts intersected with daily life. These photographs do not just document damage; they show where communities, infrastructure, and ecosystems are most exposed.
Introduction
Many of the strongest photographs from 2025 focused on single, clear moments: a highway shrouded in wildfire smoke, children wading through knee-deep water, a glacier face reduced to blocks of ice. Those frames answered a basic question people feel but do not always name: where is climate change visible today? The images of 2025 linked visible extremes to systems that people interact with — from power grids and farms to coastal towns and mountain tourism.
Photographs play two roles at once. They compress complex scientific trends into a single, graspable scene. At the same time, they can mislead if presented without context: a dramatic flood photo may show aftermath at a single location but not explain how often such floods have become more likely. That tension — between powerful storytelling and the need for careful context — is central when six photographs are used to represent a full year of climate impacts.
Below, each chapter treats a different angle: what the six recurring image types reveal about the physical changes, how everyday life felt those changes, the editorial and ethical choices behind the pictures, and what those visuals suggest about medium-term developments for communities and policy.
Why these six images matter
Photographers and news outlets in 2025 returned again and again to six motifs because each captures a different facet of climate risk. Together they form a compact visual vocabulary that helps non-experts recognise patterns across continents.
A single photograph can make a slow process suddenly visible — for example, how repeated hot seasons reshape a town’s trees, fields and daily routines.
Here are the six motifs and what each signals:
| Image type | What it shows | Why it matters |
|---|---|---|
| Extreme-heat cityscapes | Urban heat, heatwaves, people in shaded microspaces | Signals rising health risks, stress on energy systems |
| Wildfire smoke and burnt landscapes | Loss of forests, air-quality crisis, displaced residents | Highlights land management and emergency-response limits |
| Flooded streets and inundated homes | Infrastructure failure, rapid-onset events from heavy rainfall | Reveals vulnerabilities in drainage, housing and planning |
Three further motifs often appeared alongside the above: cracked, drought-affected fields showing agricultural stress; glaciers with exposed bedrock or calving ice documenting long-term melt; and satellite-derived heat maps or fire-detection frames that place local photos within a broader environmental pattern. Each motif adds a different timescale. Floods and fires are sudden; drought and glacier loss are processes visible over years. The combination explains both immediate damage and persistent change.
Technically, 2025 photography benefited from more accessible drone footage and higher-resolution satellite imagery. That expanded the visual toolkit journalists use to link ground-level scenes with regional patterns — for example, pairing a photo of a flooded market with a satellite image of the river basin showing how rainfall and land-use combine to worsen runoff.
What the pictures show in everyday life
When you look at a single photo from 2025, the immediate reaction is often emotional: worry for the people pictured, admiration for rescue workers, or shock at a collapsed road. The practical stories behind those images explain how climate effects reach routines and budgets.
Heatwave images captured more than empty streets. They documented how homes without cooling become health risks, how hospitals face higher patient loads during hot spells, and how electricity demand spikes when many people use air conditioning at once. For cities this produced visible strain: overloaded substations, crews setting up temporary cooling centres, and heat-weakened asphalt. Photographs of urban heat therefore hint at interconnected systems — public health, energy supply and urban design.
Flood photos often highlighted everyday infrastructure failures: supermarkets with ruined food, road signs half-submerged, and commuter trains halted. Those scenes show the economic ripple effect: lost working days, repair bills, and disrupted supply chains. Images of farmers standing amid cracked soil or withered crops put a human face on yield reductions and food-price pressure.
Wildfire photography in 2025 frequently included both the blaze and its aftermath: families returning to smouldering properties, schools closed due to smoke, and livestock losses. These images made visible decisions communities must take more often — when to evacuate, how to protect buildings, and how to plan landscapes to reduce risk.
Finally, glacier retreat photos provided a different lesson. They are rarely about an acute emergency and instead show long-term landscape change: formerly thick glacier fronts now reduced to ice fragments, formerly icy slopes exposing moraines and boulders. Such visuals matter for water supply in regions that rely on seasonal melt, and for tourism economies that depend on predictable mountain conditions.
Across all motifs, a repeated visual subtheme in 2025 was resilience in action: people building temporary defenses, community-led cleanups after floods, and local initiatives installing shade trees. Those actions are visible in photos and point to what adaptation looks like on the ground: small, practical, and often underfunded.
Journalistic choices and ethical tensions
Editorial teams in 2025 faced repeated choices about which images to publish and how to caption them. A strong photograph increases public awareness, but it can also create misunderstandings if context or timeframes are missing. That is why reputable outlets pair dramatic frames with background data: rainfall records, fire-season duration, or glacier mass-balance figures.
Verification became more important as social media amplified single frames. Journalists checked EXIF metadata, contrasted images with satellite timestamps, and sought agency or photographer credits. Trusted agencies and organisations — including major news services and scientific observatories — provided the most reliable captions. Where doubt remained, editors labelled images as unverified or provided the best-available context.
Ethical concerns also shaped coverage. Photographers must balance the public interest in showing devastation with respect for people who are vulnerable or grieving. Consent issues arise when images show injured or exhausted individuals. Editorial guidelines increasingly recommended anonymising victims and avoiding sensationalist cropping that removes critical context.
Another tension was between local specificity and global narrative. A photo of a flooded coastal town tells a local story — perhaps due to land subsidence, poor drainage, or a storm surge — but editors and readers often interpret it as a generalized sign of global sea-level rise. Providing explanatory text and linking to authoritative sources helps prevent overgeneralisation without reducing visual impact.
Finally, photographers and scientists sometimes disagreed on interpretation. Scientists stressed careful attribution: not every extreme event is fully caused by climate change, though the odds of many extremes increase with warming. Responsible photo stories therefore framed images as evidence of increased exposure and vulnerability, rather than sole proof of a cause-effect relationship.
Where the images lead us next
Photographs from 2025 shaped conversations about where investment and policy are needed. Images of repeated flood damage, for example, made it easier for local councils and insurers to argue for changes in land-use planning or for infrastructure upgrades. Heatwave photography highlighted the immediate need to rethink building standards and urban greening to reduce temperatures.
At the same time, visuals can drive uneven responses. A widely shared wildfire photograph may trigger emergency funding for affected regions, while slow-onset impacts, such as groundwater depletion visible only to specialists or in long-term photo series, receive less attention. That difference matters because many adaptation challenges require sustained funding and technical planning, not only one-off relief.
Looking forward, three trends are likely to affect how climate images function. First, better integration of satellite and drone data with ground photography will improve attribution and context. Second, more local journalists and community photographers will contribute images, diversifying perspectives beyond national agency feeds. Third, editorial standards for labelling and sourcing images will continue to tighten, reducing the spread of misleading frames.
For readers, the implication is straightforward: treat striking photos as entry points, not final explanations. Use them to notice patterns — repeated heat, recurring floods in the same valley, or ever-smaller glaciers on the same mountain — and then look for the accompanying data and reporting that explain causes and likely trends.
Conclusion
The six recurring photograph types of 2025 gave public faces to weather extremes and long-term change. Together they clarified where exposure and vulnerability intersect: cities and ageing infrastructure facing heat, communities at the margins of floodplains, farms sensitive to shifting rainfall, and meltwater-dependent regions watching glaciers shrink. Photographs remain a powerful bridge between scientific data and personal experience, provided captions, metadata and scientific context accompany them. When that link exists, images support more informed public debate and more targeted policy responses.
Share your thoughts and photos from 2025 — respectful comments help broaden the conversation.


Leave a Reply