AI water use is often visible only in technical metrics, but it matters where data and models run. This article shows the main drivers behind the water a data center consumes: a reporting metric called Water Usage Effectiveness (WUE), the role of cooling systems, and how electricity sources add an indirect water footprint. Readers get practical ranges, clear comparisons, and a simple method to estimate water related to model training or service operation.
Introduction
When a language model answers a question or a photo is analysed, powerful servers in data centres do the work. Those servers need cooling and electricity; together they determine how much water is used directly at the site and indirectly in power production. For people tracking sustainability or curious about the hidden impacts of AI, the important point is that the same computational task can have very different water consequences depending on where and how it runs.
This article focuses on clear, lasting facts: a standard reporting metric (WUE), typical numbers for different cooling approaches, and a simple calculation pathway that anyone can follow to estimate a model’s water footprint. The main keyword for this article is AI water use, and it appears in the practical headings below so you can quickly find the numbers and explanations that stay relevant over time.
How AI water use is measured: WUE and related metrics
Water Usage Effectiveness (WUE) is the primary way the industry reports direct water use. WUE is calculated as the annual site water consumption (in litres) divided by the useful IT energy delivered (in kWh). The unit is litres per kilowatt‑hour (L/kWh). The value helps compare how much fresh water a facility uses to support a given amount of computing.
WUE has limits. Different reports choose different scopes: some include only cooling water, others add landscaping, kitchens or site services. Because of this, WUE numbers are useful for relative comparison only when the scope is identical. WUE should always be read together with PUE (Power Usage Effectiveness), which shows how much extra energy the site uses beyond IT equipment.
A single WUE number is a reporting snapshot; the meaning depends on what water flows were included.
To make the concept concrete, a short table helps. The ranges below are rounded industry estimates and depend heavily on climate and cooling type.
| Feature | Description | Value (indicative) |
|---|---|---|
| WUE (definition) | Annual site water (L) ÷ IT energy (kWh) | unit: L/kWh |
| Modern air‑cooled sites | Mostly fans and dry heat rejection; low direct water use | ≈0.00–0.5 L/kWh (indicative) |
| Evaporative or open wet cooling | Uses evaporation to shed heat; higher direct water use | ≈1–10+ L/kWh (wide variation) |
These ranges are consistent with industry guidance but vary by provider and the exact definition used. The Green Grid documented the WUE concept early on as a reporting metric; the metric remains useful when readers check which water flows are included. Many operator sustainability reports and industry analyses stress that WUE alone does not indicate overall sustainability without local water‑stress context and energy sourcing information.
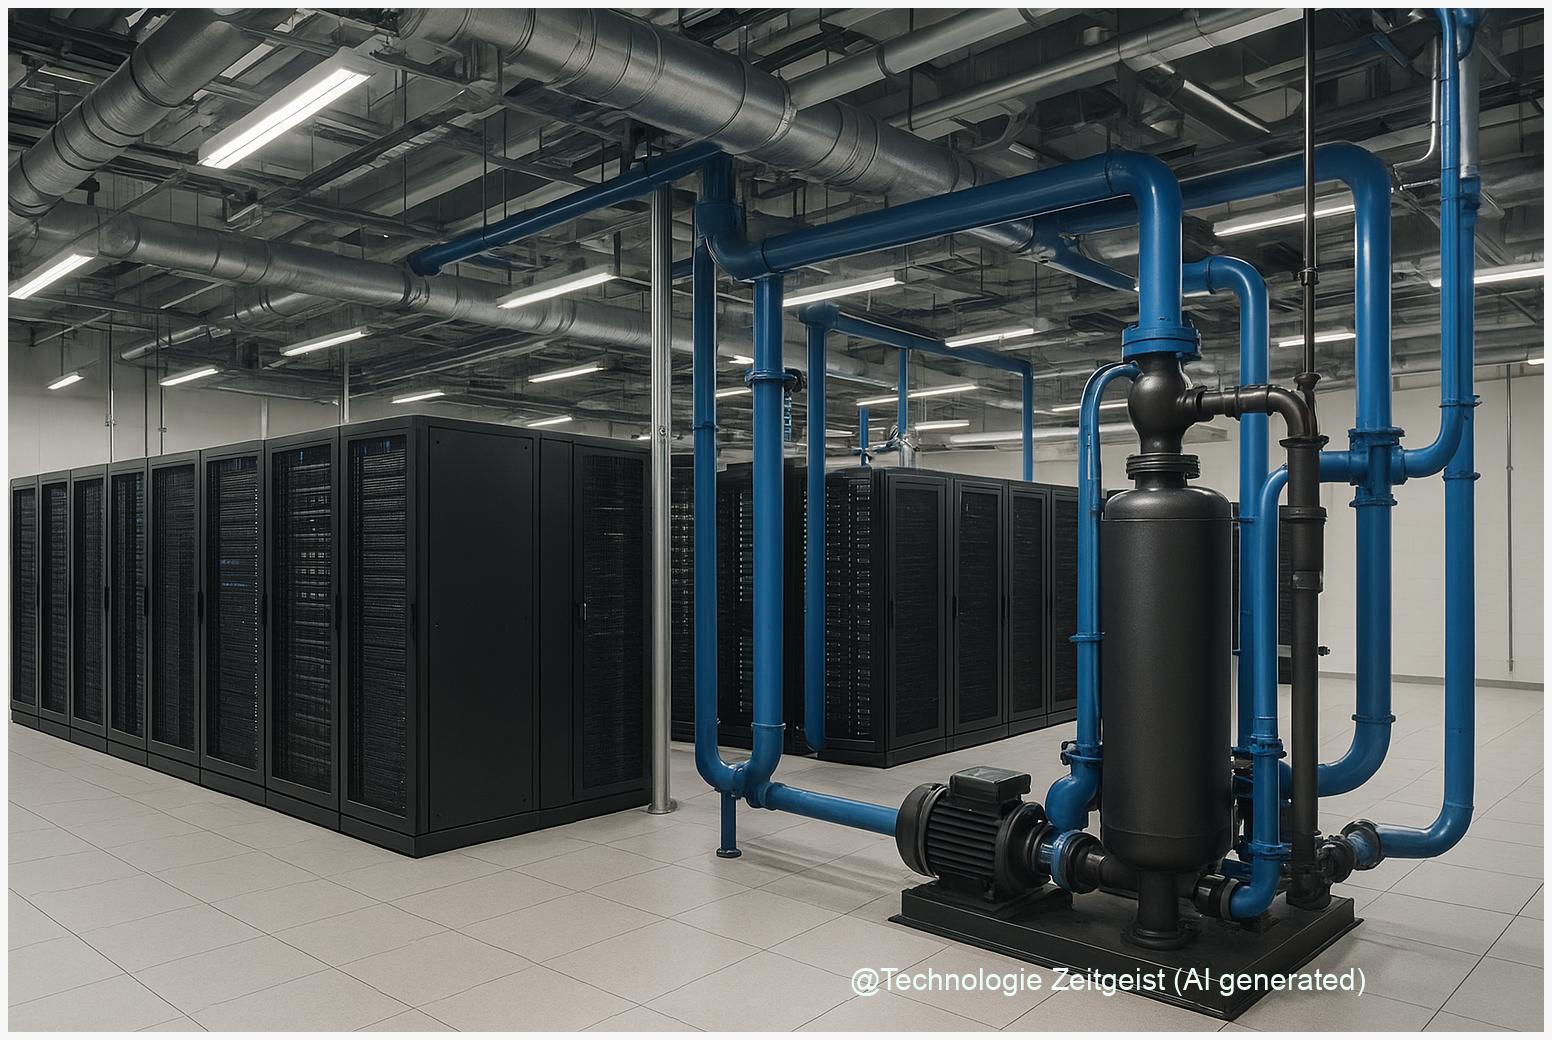
Cooling types and everyday examples
Cooling systems are the main direct driver of data‑centre water use. There are three common approaches:
Air‑cooled systems: Hot air is moved away by fans and heat exchangers. These designs use little or no fresh water directly. They are common in cooler climates or where water is scarce.
Evaporative or wet cooling: Water evaporates to remove heat, similar to how a car radiator works. This method can be very water‑efficient in energy terms but adds substantial direct water consumption. Think of it as a garden sprinkler that cools by evaporation — useful where water is abundant or recycled.
Liquid cooling and immersion: Liquids run close to the chips or servers to move heat away more efficiently. These systems can greatly reduce the amount of air movement needed and often cut overall energy use; their direct water use depends on how the heat rejector is designed (air condenser versus evaporative tower).
Everyday example: charging your phone does not consume water in the charger, but the electricity used to run the charger may come from a power plant that needs cooling water. Similarly, an AI model’s computation in a data centre may use little on‑site water if air‑cooled, but the same electricity sourced from thermoelectric plants can carry a large indirect water footprint.
To estimate water for a task, a simple two‑step rule works:
- Estimate the total energy for the task in kWh and adjust by the site PUE to include overheads.
- Apply a water intensity figure: add direct cooling water (L) from WUE or use the local electricity water‑intensity (L/kWh) to capture the indirect water tied to power generation.
This method produces a range rather than a single number. The main uncertainties are the exact PUE, the WUE scope, and the water intensity of the regional power mix.
Trade-offs, risks and regional pressures
Choices about cooling and electricity create trade‑offs. Air cooling tends to use more electricity in hot regions but less direct water. Evaporative cooling lowers electricity needs but increases fresh water demand. Liquid cooling can improve energy efficiency but shifts complexity to the site and can require secondary water or closed‑loop heat rejection.
Regional water stress changes the ethical and practical calculus. In a water‑scarce region, a low WUE is essential; in an area with abundant water but a carbon‑intensive grid, the indirect water tied to power plants may be less of a concern but carbon emissions become the priority. That is why WUE should always be paired with a regional water‑risk assessment and with energy sourcing information.
There are sensible risk‑mitigation measures adopted by operators: locating new data centres near renewable electricity, investing in water recycling and closed cooling loops, and committing to transparent reporting with third‑party audits. These actions reduce both water and reputational risk — but they require site‑level disclosure of PUE, WUE scopes, and cooling technology.
For companies and public agencies, the important tension is between efficiency and resource limits. A highly efficient cooling design that consumes local freshwater in a drought area is a poor fit; conversely, water‑light approaches that raise electricity demand in a coal‑heavy grid can increase indirect water and carbon impacts elsewhere.
What to expect next and reasonable choices
Expect three linked developments over the next years: clearer reporting standards, wider use of low‑water cooling in stressed regions, and more attention to the electricity water intensity behind digital services. Industry groups and researchers have called for harmonised WUE definitions and for joint reporting of WUE with PUE and regional water‑stress indicators. That makes comparisons more meaningful.
For people choosing services or forming opinions about AI water use, practical criteria help:
- Ask providers whether they publish PUE and a site‑level WUE with scope details.
- Prefer providers that disclose the region and the power‑source mix so you can judge indirect water tied to electricity.
- Look for commitments to reuse or replenish water locally and for third‑party audits of reported figures.
At the policy level, coupling water and energy reporting — for example requiring WUE, PUE, and a water‑stress indicator — would make AI water use comparable across jurisdictions. For individual researchers or small organisations, the simplest effective step is transparency: publish the kWh used (including PUE) and the assumed water intensity so others can reproduce any water‑footprint calculation.
Conclusion
AI water use is not a single fixed number. It is the result of choices: cooling method, site efficiency, and the water intensity of the electricity that powers the machines. WUE gives a helpful direct‑use metric, but it must be paired with PUE and regional power information to form a complete picture. Reasoned estimates are possible with a small set of transparent inputs: task energy (kWh), site PUE, local electricity water intensity, and any direct cooling water reported as WUE. That approach yields a defensible range rather than an exact figure and supports sensible comparisons and better decisions.
Share your questions or experiences with data‑centre sustainability and help the conversation.

Leave a Reply