Global solar power has reached new highs in recent years, and the surge in 2024 produced several monthly and annual records. This article looks at the scale of those gains, why months such as April attracted attention, and what the rise of global solar power means for electricity systems and everyday consumers. Readers will learn which technical frictions appear most often and which practical solutions grid operators are using now.
Introduction
In 2024 the world added a very large amount of solar capacity and produced noticeably more solar electricity than in previous years. That jump matters beyond climate targets: it changes how operators keep supply and demand balanced hour by hour. A single very sunny month in several big regions can push aggregated monthly figures to new highs — and that is why April 2024 became a focal point in many reports.
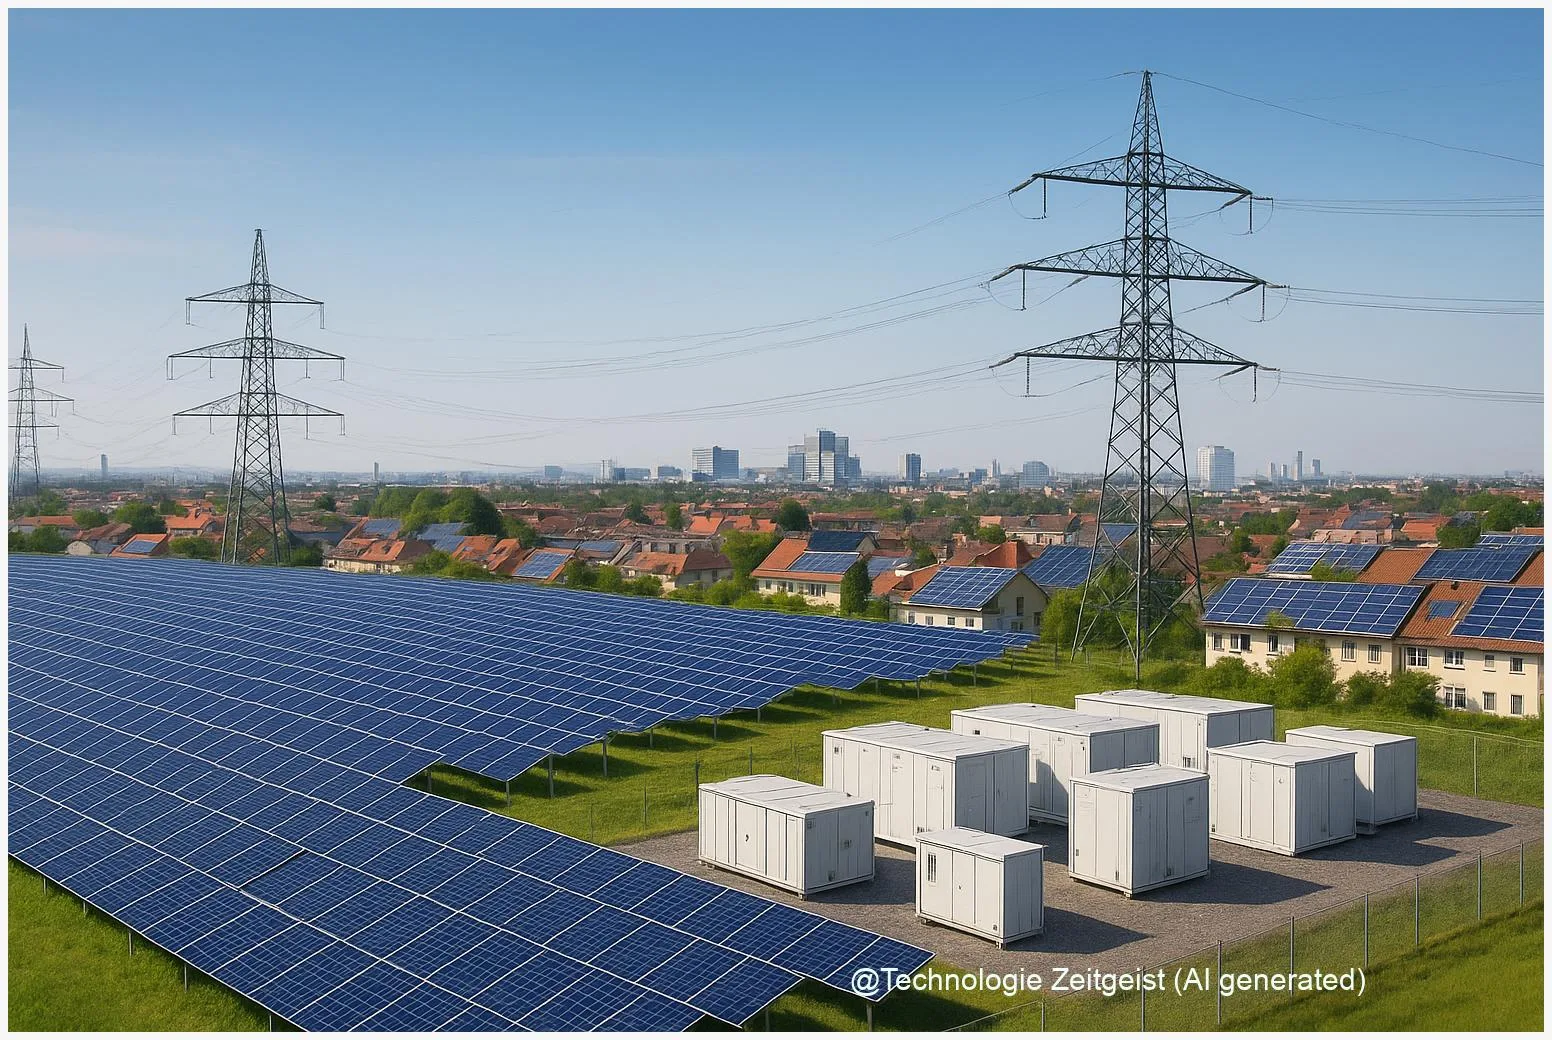
Everyday examples help: when rooftop panels and big solar farms produce a lot at midday, wholesale prices can fall and some generators are told to stop producing. At the same time, sudden drops in solar output — caused by fast-moving weather or an eclipse — require other resources to ramp up quickly. These practical frictions are the reason grid managers, regulators and investors now pay close attention to solar generation patterns, not only to annual totals but also to intra-month variations.
Why global solar power reached new highs
Solar growth in recent years has two clear drivers: more installed capacity and higher utilisation where panels already exist. Globally, cumulative photovoltaic (PV) capacity passed the multi‑terawatt threshold by the end of 2024, and several institutions reported large year‑on‑year increases in solar generation for 2024. One public estimate puts the additional global solar generation in 2024 at several hundred terawatt‑hours compared with 2023; another central estimate for new PV capacity installed in 2024 ranges in the low hundreds of gigawatts. These are rounded values, because agencies use different methods and some national reports arrive with delays.
Two technical points are important. First, capacity and generation are different: capacity (GW) is the size of panels installed; generation (TWh) is the electricity produced over time. More capacity almost always leads to more generation, but weather and system operation change how much that capacity actually produces in a given month. Second, international datasets sometimes report AC (alternating‑current) or DC (direct‑current) ratings differently; that causes small but meaningful differences when analysts aggregate data worldwide.
Authorities and research groups agree: 2024 was an exceptional year for solar additions and output, but single‑month claims need careful validation across many national reporting systems.
Why April specifically? April sits between winter and summer in many large markets. In some regions the month can offer a combination of more daylight hours, milder temperatures (panels perform slightly better when not overheated) and stable weather, yielding high production. In addition, extraordinary local events in April 2024 — for example a partial solar eclipse in parts of the United States — produced extreme intra‑day swings that show up in monthly summaries and in system operator reports, calling attention to April in news and technical briefings.
If a reader wants the raw data, primary monthly generation files are available from international datasets such as the IEA Monthly Electricity Statistics and from national grid operators. These primary files are the basis for most cross‑country comparisons and are recommended when precise monthly aggregation is required.
How high solar output plays out in daily grids
High solar output affects power systems on short time scales (minutes to hours) and on longer scales (days to seasons). The most visible short‑term effects are strong midday production peaks and rapid drops when clouds pass. Grid operators plan for those patterns with forecasts, reserve margins and market mechanisms that re‑allocate generation as conditions change.
A concrete example comes from a well‑documented April 2024 event in California. System operator reports show that during a partial eclipse and related patterns, solar availability fell sharply and then returned within hours; batteries helped to smooth the changes. In that month CAISO reported hundreds of thousands of megawatt‑hours of curtailed wind and solar energy and documented battery discharge peaks of several thousand megawatts during critical intervals. This illustrates two mixed realities: batteries are effective for minute‑to‑hour balancing but current battery volumes remain small relative to total new solar capacity; and curtailment — the intentional reduction of renewable output — continues to appear where transport or flexibility is constrained.
On a typical day with very high solar output, wholesale market prices at midday can turn very low or negative, making it cheaper to ask certain flexible resources to stop. Later, when solar falls, prices can spike briefly, signalling the need for other capacity to come online. For households and small businesses this usually means no direct disruption, but it does affect wholesale costs, subsidy accounting and the revenues of generators and storage owners.
Operators use several practical tools: improved short‑term forecasting that includes rooftop solar, coordinated charging and discharging of batteries, demand response signals to large consumers, and scheduled cross‑border transfers where transmission allows it. Together these measures reduce the need for emergency interventions and lower the total amount of energy that must be curtailed.
Tensions and trade-offs: opportunities, curtailment and markets
Rapidly increasing solar generation brings clear benefits — lower fossil‑fuel use and new revenue streams for rooftop owners — but also trade‑offs. Curtailment surfaces when the grid cannot absorb available solar power: reasons include limited transmission capacity, mismatch between when electricity is produced and when it is needed, and market rules that prioritise other resources. Curtailment is not always a sign of failure; it is sometimes a temporary outcome while grids evolve.
Markets react too. High and often negative prices at times of oversupply change investment incentives. Investors who finance batteries, flexible gas, or demand‑side flexibility look for revenue streams in those price patterns. Regulators face a delicate choice: keep price signals strong so flexibility is rewarded, or protect some generators and consumers from volatile prices through capacity payments and other interventions. Both approaches influence how quickly storage and demand‑management solutions scale.
There are also distributional questions. In some countries, curtailment increased because new utility‑scale parks were built far from load centres, while rooftop solar owners exported to local networks. Decisions on who pays for new lines, who receives compensation for curtailed output, and how to prioritise consumers interact with public policy and support schemes. Clear, transparent curtailment rules and compensation practices reduce investor uncertainty and help align expectations.
Finally, the notion of reliability needs nuance. Short‑term reliability — keeping the lights on every hour — is managed successfully in most regions with a mix of forecasts, flexible reserves and storage. Long‑term reliability — ensuring enough energy across seasons — points to a need for longer‑duration storage or other seasonal flexibility options, which remain nascent in commercial scale in most markets.
What comes next for grids, storage and policy
Expect gradual but steady changes. In the short term, more operational practices will be adopted: better intraday markets, mandatory forecast sharing for distributed assets, and targeted battery dispatch rules. These measures are mostly technical and already being piloted in multiple regions.
Over the medium term, investment will shift toward flexibility: more batteries located close to load, incentives for aggregating small‑scale resources, and trials for long‑duration options such as pumped hydro, hydrogen and other power‑to‑X pathways. Policy will matter: auctions that require co‑located storage with new solar projects reduce curtailment risk and improve local balancing. Grid planning that anticipates where capacity and demand grow will lower the need for emergency interventions.
Cross‑border trading remains a powerful lever. When neighbouring regions have different peaks and weather patterns, transmission links allow surplus solar to move where it is needed. Europe already benefits from cross‑border flows; in other regions, building such links requires political coordination and financing but delivers long‑term value.
For individual consumers the practical effects will be familiar: cleaner electricity, growing options to pair rooftop solar with home batteries, and more dynamic tariffs that encourage shifting consumption to daytime in areas with abundant solar. For system planners, the task is to build rules and infrastructure so that rising solar output translates into cheaper and reliable power rather than higher curtailment losses.
Conclusion
Solar generation reached very high levels in 2024 because of large additions of PV capacity and favourable production conditions in several regions. Monthly highlights such as April attract attention because they reveal short‑term stresses and the practical limits of current grid flexibility. Batteries, improved forecasting and better market rules reduce these frictions, but they must scale faster to match the pace of solar additions. Policymakers, grid operators and investors are adapting: the next few years will be decisive for whether higher solar output mostly lowers system costs or increasingly leads to avoidable curtailment and volatility.
We welcome constructive comments and sharing of local experiences with solar generation and grid integration.

Leave a Reply