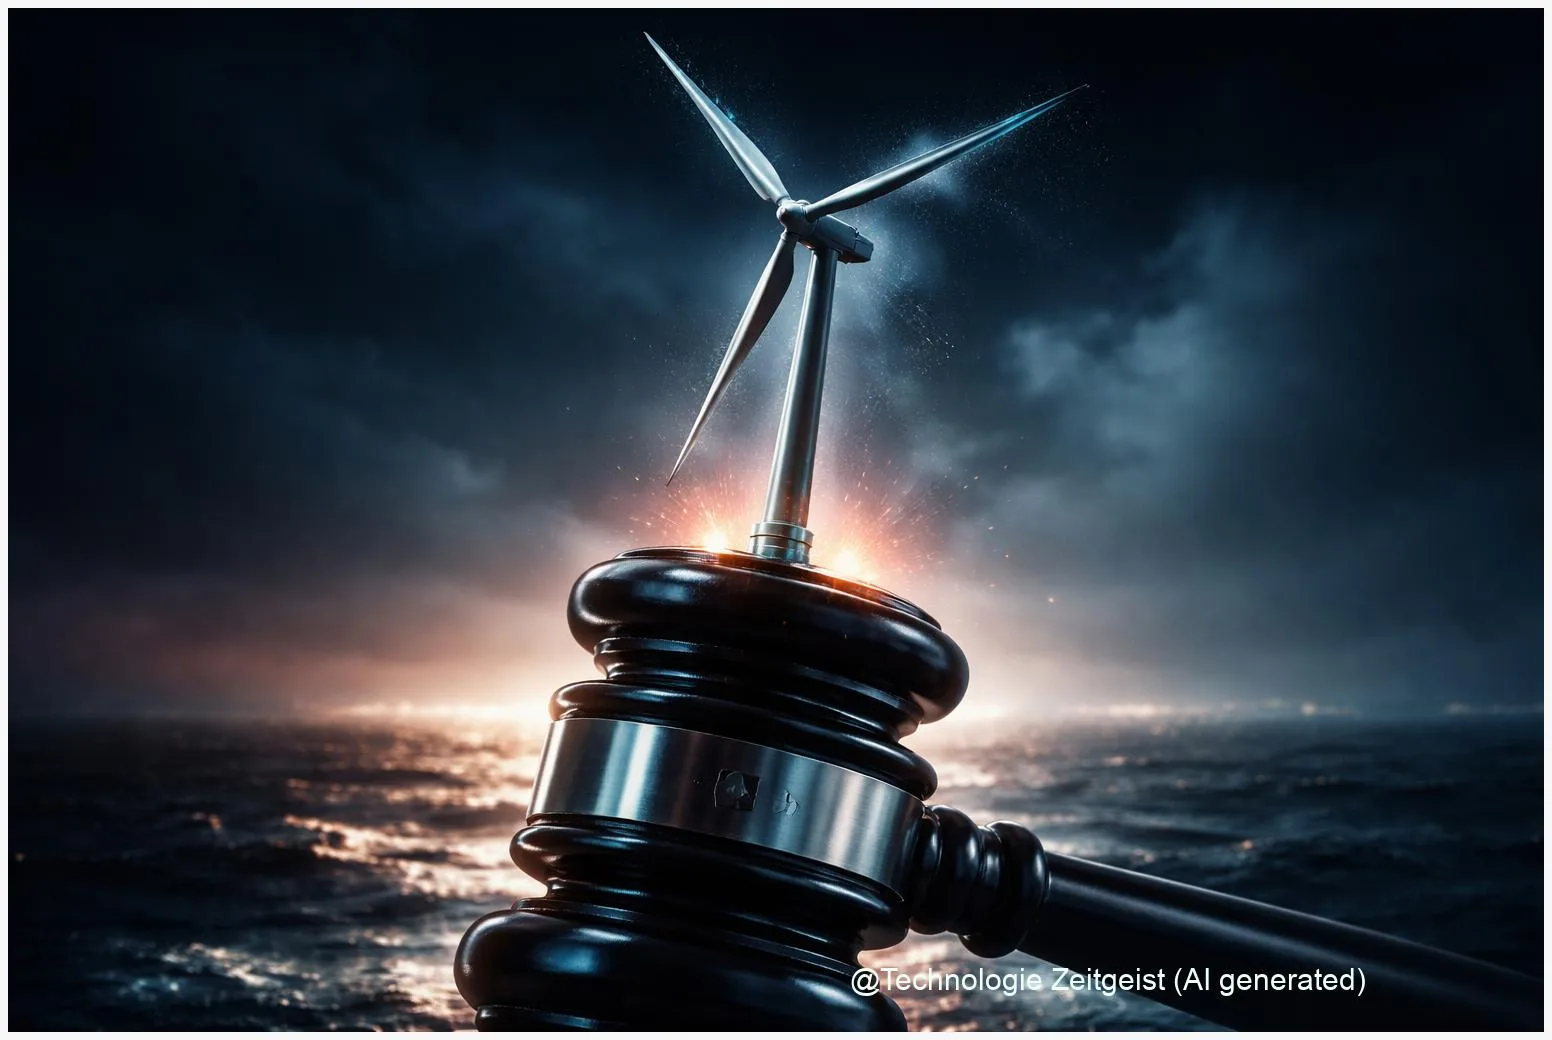
A recent offshore wind auction produced headlines about a “record” price. The term “Offshore wind auction” refers to the procurement process and the strike prices bidders accept; it does not automatically set the price you pay at home. Whether your bill falls depends on how the contract payments are financed, how often market prices sit above or below the strike, and the balance of payments across all awarded projects. This article shows what the numbers mean for households and businesses in clear, practical terms.
Introduction
Auctions for offshore wind decide which projects win the right to build and at which guaranteed price. Winners typically receive a Contract for Difference (CfD) or similar financial guarantee: if market prices are below the strike, the generator receives the difference; if market prices are higher, the generator pays back. Headlines about a “record” therefore focus on the strike numbers and competition at auction. For consumers the real chain runs further: strike → CfD cash flows → how payments are financed (a consumer levy, general budget, or other mechanism) → the household or business bill.
This introduction frames the three simple questions many readers have: (1) Does a low strike automatically lower retail electricity prices? (2) How large can the consumer share of CfD payments be? (3) Which design choices change the result? The following chapters explain the mechanics step by step and give compact, realistic examples so you can see the likely order of magnitude for your own bill.
What an Offshore wind auction ‘record’ actually measures
An “offshore wind auction” awards developers the right to build and usually sets a strike price per megawatt-hour. The strike is an input to a two-way CfD in many markets: it is a financial reference, not a wholesale price cap. Two important consequences follow. First, the strike reflects investor expectations about costs and future market revenue; strong competition can push strikes down. Second, the strike only creates payments later if the realized reference price differs from it.
A low strike does not mechanically equal lower retail prices; it changes expected cash flows that must be financed or netted across the system.
To make this concrete, here are the headline numbers from a recent large auction used in public analyses: awarded capacity around 8.4 GW and blended fixed‑bottom strikes near £91/MWh for some sites. Capacity factors for offshore wind commonly range from about 35 % to 50 %; using a conservative 40 % gives an approximate annual generation to feed into simple scenarios.
The short table below summarises the core auction figures and a simple derived output that is useful for scenario estimates.
| Feature | Description | Value |
|---|---|---|
| Awarded capacity | Total procured in the round | ~8.4 GW |
| Blended strike | Reported round figure for fixed projects | ~£91/MWh |
| Estimated annual generation | Using a 40 % capacity factor | ~29.4 TWh/year |
Those values are the starting point for the next step: turning strike differences into net payments and then into levies or savings. We will explain that pipeline in the next chapter.
How strike prices can end up on your bill
The financial chain from auction to household bill passes through three layers. Layer 1: CfD mechanics. A two‑way CfD pays (strike – reference price) × generation each hour. If the reference price (often the hourly wholesale price) is lower than the strike, the generator receives the difference. If it is higher, the generator repays. Layer 2: aggregation and financing. Systems aggregate payments across all CfD projects; the program must decide whether net payments are covered from general government budgets, a dedicated levy on electricity bills, or some other source. Layer 3: distribution to consumers. If a levy finances CfD net payments, the levy is spread across system demand or households, producing an annual per‑household effect.
Simple math clarifies orders of magnitude. Use the numbers above: ~29.4 TWh annual generation. If average wholesale prices in a year were, for example, £60/MWh and the strike is £91/MWh, the difference is ~£31/MWh. Multiplying by 29.4 TWh gives annual net payments in the order of £900 million. Split across roughly 28 million households (rounded for order‑of‑magnitude), that is about £30 per household per year. Reverse the story: if wholesale prices average £120/MWh, generators would pay back and households could see a similar-sized reduction in the levy.
Two key caveats matter. First, hourly modelling changes the picture: wind produces at different hours than demand or gas‑set price peaks, so the hourly correlation between wind generation and wholesale prices affects net payments materially. Second, how payments are financed is political. A government that absorbs payments from the budget produces a different consumer outcome than one that places them on bills. The CfD design (hourly reference, zonal average, or capacity‑style financial reference) also affects volatility and who benefits in different years.
In short: strike prices are a visible auction outcome, but they only become a consumer cost or saving through the realized year‑by‑year market prices and the chosen financing route. That explains why a reported “record” strike can be true while consumer impacts still vary widely by scenario.
Everyday examples: households and companies
Concrete examples make the mechanisms feel less abstract. Example A is the single‑year levy scenario above: wholesale average £60/MWh, strike £91/MWh, net payment ≈ £900 million, household impact ≈ £30/year. Example B flips the prices: average wholesale £120/MWh leads to a net collection of a similar order, reducing bills by a comparable amount. These are simplified single‑year calculations but they show the correct order of magnitude: tens of pounds per household per year for large award rounds.
For businesses the per‑kWh effect matters more than an annual figure. If a uniform levy were applied per MWh, a levy of say £1/MWh on system demand produces a small per‑kWh increase for a large user, while a £10/MWh levy would be noticeable. The actual levy per MWh is total net payments divided by system demand. That is why energy intensive industries track both total system generation and expected payment direction before concluding on competitiveness impacts.
Integration costs and system benefits also change the arithmetic. Additional offshore capacity tends to lower spot prices at times by displacing gas‑set marginal generation; that effect can partly offset CfD payments. Moreover, pairing wind with storage or better grid links can increase the market value of wind output and reduce the size of net CfD payments. For practical reporting on storage and local flexibility, see our pieces on battery storage and local energy trading, which explain how storage and settlement design influence value and resilience:
– A technical perspective on grid‑connected storage and operational risks: Battery Storage Cyber Risks: Why the Grid Is Exposed.
– How local trading and storage change who keeps value from rooftop or distributed generation: Solar power trading: How neighbors could buy your rooftop power.
Both links provide practical context: storage can shift when energy is sold, and local markets change settlement arrangements — both affect how auction outcomes translate into bills.
Opportunities, trade-offs and scenarios
Looking ahead, three scenarios illustrate how a low strike can lead to different consumer outcomes. Scenario 1 — Budget financing: if the state meets net CfD payments from general funds, retail bills may not rise, but public finances absorb the cost instead. Scenario 2 — Consumer levy with low wholesale prices: if wholesale prices are below strikes for many hours, a levy appears on bills and households see an increase (the single‑year example above). Scenario 3 — High wholesale prices or significant price suppression from added wind: generators may pay back overall, producing a net consumer benefit.
Which scenario is likeliest depends on the following tensions. One, how fast another 8–9 GW of offshore capacity changes wholesale price formation; added low‑marginal‑cost generation can push some peak prices down but may leave scarcity prices intact in tight hours. Two, the CfD reference design: an hourly spot reference more tightly ties payments to market outcomes, while other references smooth payments and change incentives for investment location and timing. Three, political choices shape financing.
For policy and readers who care about their bills, the pragmatic takeaway is to watch three signals after any auction: the auctioned volume and strikes, the expected hourly price paths published by system operators or analysts, and the government’s decision on financing (levy vs budget). Those three pieces together allow simple scenario calculations such as the household examples above.
From an individual point of view, consumers can respond in modest ways: increasing energy efficiency reduces exposure to levies; customers with flexible demand or storage may gain by shifting consumption to low‑price hours; and businesses should engage with suppliers or aggregators to understand pass‑through clauses in contracts.
Conclusion
A reported “record” in an offshore wind auction primarily describes the strike prices and procurement competitiveness. Those strikes influence future cash flows through CfDs, but whether your electricity bill goes up or down depends on realized wholesale prices, the CfD reference mechanics, and who covers net payments. Simple scenario math shows the scale: for a large round of awards the household effect is likely in the order of a few tens of currency units per year for single‑year swings of tens of £/MWh, not hundreds. The policy choice about financing — levy or budget — and system effects such as price suppression or higher scarcity prices are decisive. Keep an eye on auction volumes, strike levels, government financing decisions and system price scenarios to see what a particular auction means for you.
Share your view: has your household seen changes tied to renewables procurement? Join the conversation and share this article if you found the explanation useful.
Leave a Reply