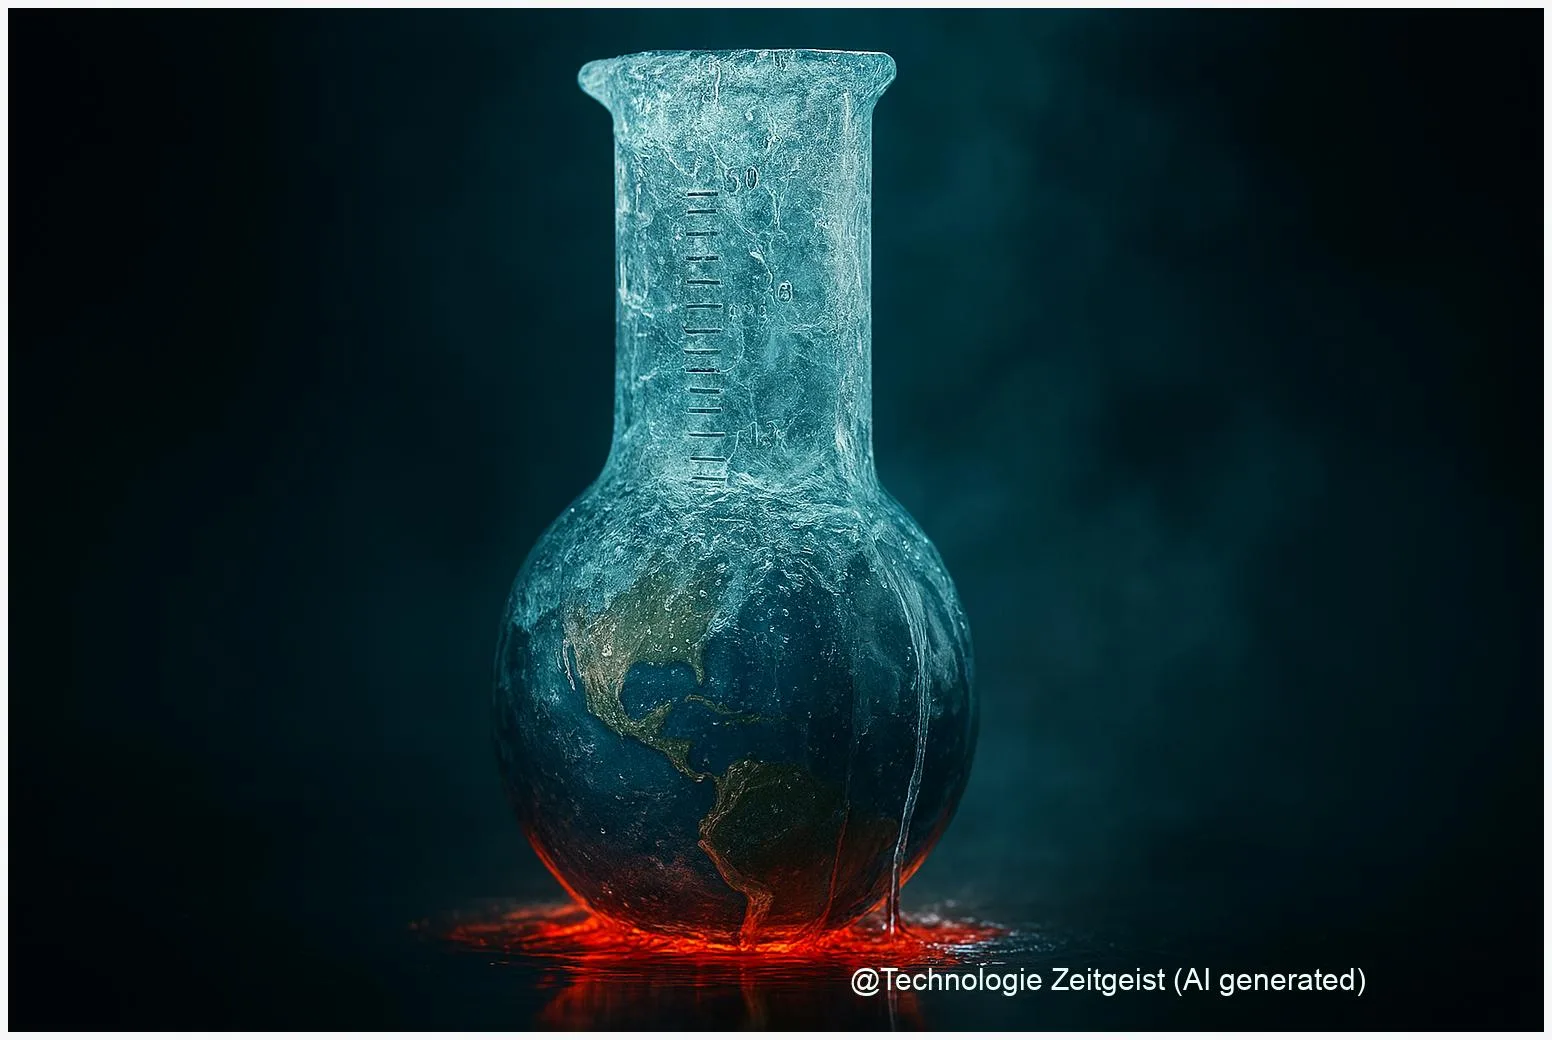
The Thwaites Glacier holds roughly 0.65 m of potential global sea-level rise. That number can sound abstract, so this article places it in plain context: what the figure actually means, how scientists measure the glacier’s behaviour, and the realistic ranges for its contribution through 2100. The focus is on measurable risk—centimetres of added sea level this century under most scenarios, with larger rises possible over centuries—so readers understand the scale and uncertainty.
Introduction
The Thwaites region sits on a wide, sloping bed that can allow ice to retreat rapidly once certain thresholds are crossed. Many coastal planners and curious readers ask the same question: does Thwaites threaten to raise sea level by metres within our lifetime? The short, evidence-based answer is: not likely as a sudden, global metre-scale jump this century, but the glacier is a critical wildcard whose changes could add measurable centimetres to sea level by 2100 and drive larger rises over centuries.
To make that useful, this introduction avoids technical detail while setting the scales. The glacier contains the equivalent of about 0.65 m of global sea-level rise if all the ice now grounded in its basin were to enter the ocean. Scientists combine direct observations, underwater surveys and computer models to estimate current losses (measured in gigatonnes per year) and future ranges (measured in centimetres to metres). Understanding the difference between theoretical potential and plausible century-scale contribution is central to sensible planning.
Why Thwaites Glacier matters for sea level
Thwaites matters because of its size and geometry. The basin contains ice whose melt would raise global sea level by about 0.65 m. That is a theoretical value called sea-level equivalent: it counts the water locked in the grounded ice if it eventually reaches the ocean, distributed across the globe. It does not mean 0.65 m will arrive all at once.
The sea-level equivalent is a measure of stored potential; how fast that potential converts to actual sea-level rise depends on ocean warming, bed shape, and how quickly ice shelves weaken.
Current observations show Thwaites contributing to global sea-level rise already, but at a modest rate compared with that stored potential. Measurements indicate order-of-magnitude losses near ~50 Gt/yr (gigatonnes per year) in the basin in recent assessments; this roughly translates to a small fraction—around 4 %—of the modern annual global sea-level rise rate. That means the glacier is measurable today, but it is not producing metre-scale change within a single decade.
To keep numbers usable: models and expert assessments typically place Thwaites’ plausible contribution to global sea level by 2100 in the range of a few centimetres to, in some higher-end model runs, roughly 6 cm. Those projections are model-dependent and carry real uncertainty: while the basin stores ~0.65 m of potential rise, delivering that volume would likely take centuries without a sustained and very large increase in ice loss rates.
If a compact table helps compare terms, the following shows the central metrics at a glance.
| Feature | Description | Representative value |
|---|---|---|
| Sea-level equivalent | Total grounded ice in Thwaites basin | ≈ 0.65 m |
| Recent annual loss | Observed net mass loss | ≈ 50 Gt/yr |
| Likely 2100 contribution | Range from model ensembles | Few cm to ≈ 6 cm |
How scientists measure and model the glacier
Scientists use three complementary approaches: remote sensing, field campaigns and numerical models. Satellites track changes in surface height and speed; airborne and shipborne instruments map ice thickness and the ocean under the ice shelf; and computer models test how ice and ocean interact. Each method fills a gap the others leave open.
Remote sensing gives continuous, broad coverage. Radar and laser altimeters detect thinning; optical and radar imagery show ice-shelf fractures and flow speed. These tools reveal year-on-year trends across the entire basin, but they cannot see the detailed shape of the bedrock below the ice—critical for predicting how far inland ice can retreat.
Field campaigns and autonomous underwater vehicles (AUVs) provide that detailed view. AUVs map cavities beneath ice shelves and measure warm water intrusions that drive basal melting. Shipborne seismic surveys and radar soundings reveal bed topography and locations where the ice rests on pinning points. Many of these datasets date from 2020–2023; some of the foundational factsheets and surveys are older than two years and are therefore combined with newer results to reduce bias.
Models tie observations together and explore futures. Ice-sheet models vary in resolution and in how they represent processes such as sub-shelf melting and grounding-line retreat. Because the bed beneath Thwaites slopes inland, many models show a vulnerability called marine ice-sheet instability: once retreat begins past certain points, grounding lines can retreat rapidly. That sensitivity is why models give a broad range of outcomes rather than a single number.
Practical example: if warm ocean water increases melting under the floating ice shelf, the shelf thins and its buttressing effect weakens. The grounded ice upstream then flows faster into the ocean. Models simulate that chain using observed ocean temperatures and bed maps, producing century-scale ranges used by planners.
Scenarios, risks and what they mean for coasts
What could happen depends on three interacting elements: the amount of ocean heat delivered to Thwaites’ cavity, the detailed shape of the bed and the structural state of the ice shelf. In many scenarios the glacier contributes modestly to sea-level rise by 2100—measured in centimetres—but the possibility of episodic, faster retreats remains.
For coastal communities, the difference between a few centimetres and a few decimetres by 2100 matters for planning but does not change the basic need to adapt. Centimetre-level additions amplify storm surge and high-tide flooding, making nuisance floods more frequent. Planners who use only central estimates may underestimate the value of flexible, incremental measures such as managed retreat corridors and elevation of critical infrastructure.
Risk communication requires ranges, not single numbers. Some model runs show limited impact through 2100, while high-end runs with sustained warming and strong ocean forcing yield larger contributions. Geological evidence and recent underwater surveys also show that past retreats at Thwaites could be rapid at local scales; these findings keep higher-end scenarios plausible even if they are not most likely.
It is also important to separate the Thwaites signal from the global sea-level story. Global sea-level rise is a sum of many contributors—thermal expansion of the oceans, melting of mountain glaciers, and ice loss from Greenland and other Antarctic sectors. Thwaites is a high-priority source of uncertainty because its behaviour could drive larger-than-expected long-term rise, but it is not the sole driver of near-term coastal impacts.
Looking ahead: monitoring, decisions and planning
Monitoring must continue and expand. The most valuable investments are repeated bed mapping, continuous satellite mass-balance records and sustained ocean observations in the troughs that feed warm water under the shelf. These data narrow model uncertainty and provide early warning of unusual retreat pulses.
Model improvements matter too. Better coupling of ocean and ice physics and higher-resolution bed maps reduce the spread of projections. Researchers recommend combining model ensembles with geological records to test whether models can reproduce past rapid retreats; this increases confidence in future scenarios.
For policy and planning, the right framing is scenario-based and adaptive. Coastal authorities benefit from planning that assumes a central range of centimetres by 2100 while using contingency plans for larger rises over longer timescales. Insurance, land-use zoning and critical-asset elevation are practical tools that remain useful across most plausible futures.
Finally, global choices about greenhouse gas emissions influence the long-term outcome. Lower emissions reduce the ocean warming that drives sub-shelf melting, and they therefore lower the probability of the most extreme, long-term loss of grounded ice. That connection links local coastal decisions with global climate policy over decades and centuries.
Conclusion
Thwaites Glacier contains the equivalent of about 0.65 m of global sea-level rise but that potential is spread across long timescales. Observations and models indicate a likely contribution of a few centimetres by 2100 in many scenarios, while higher-end outcomes remain possible if ocean warming and ice-sheet dynamics align. The immediate priority is sustained observation and model validation so planners receive timely, narrower ranges to work with. For coastal communities the practical takeaway is to plan for incremental sea-level changes now while keeping contingency options for larger, slower rises.
Join the conversation: share your views and local experiences with coastal planning and sea-level science.

Leave a Reply